Today, I was working on some project with Entity Framework 6.1.3 and got the following error.

To navigate through this, I just clicked the refresh icon which was shown at the beginning of the message. This displayed the expected value of that instance.
This message isn't exactly an error rather a feature of the debugger. Let's see how.
One of the risks of evaluating the properties using a debugger is that the system might enter an inconsistent state.
e.g. Let us consider a hypothetical scenario as shown below where the _salary variable is incremented and returned every time the get accessor is called.

Here, when I keep a breakpoint on Console.ReadLine() and try to find the value of personDto.Salary, as expected, it changes every time.


This is a simple example where the code evaluation takes place on the same thread. However, this is not always the case. Sometimes, the code might need to be evaluated in a separate thread e.g. a remote call. The debugger does not perform this function automatically, it asks for your permission. If you click the refresh icon, it goes ahead and executes the code required to fetch the value of the variable.
Technically, while debugging when we hit the breakpoint, all the threads other than the one on which the application is running are frozen. So, if we need a code to be executed which requires a separate thread, it will create a deadlock. This scenario is prevented by a mechanism where the debugger allows only 5 seconds of time to the evaluation code. If the evaluation code cannot return any value within those 5 seconds, the debugger returns a Function evaluation timed out. message.
It is obviously little irritating to wait for 5 seconds and then get to know about Function evaluation timed out. To prevent that, we have a notification mechanism which can tell that a particular execution requires other threads as well and might take time.
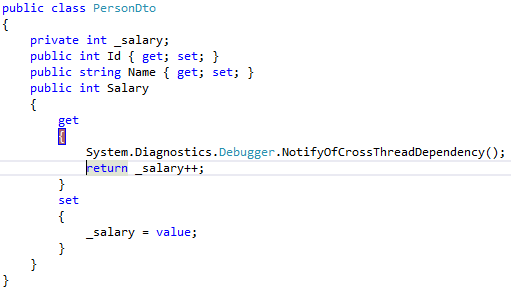
System.Diagnostics.Debugger.NotifyOfCrossThreadDependency() method is used to perform this function. We can add this method to the properties where we, as developers, feel that it might take more time as shown below.

It shows us the message for the Salary property.

If we still go ahead and evaluate it, it'll show us the value.

Hope this helps.

To navigate through this, I just clicked the refresh icon which was shown at the beginning of the message. This displayed the expected value of that instance.
This message isn't exactly an error rather a feature of the debugger. Let's see how.
One of the risks of evaluating the properties using a debugger is that the system might enter an inconsistent state.
e.g. Let us consider a hypothetical scenario as shown below where the _salary variable is incremented and returned every time the get accessor is called.

Here, when I keep a breakpoint on Console.ReadLine() and try to find the value of personDto.Salary, as expected, it changes every time.


This is a simple example where the code evaluation takes place on the same thread. However, this is not always the case. Sometimes, the code might need to be evaluated in a separate thread e.g. a remote call. The debugger does not perform this function automatically, it asks for your permission. If you click the refresh icon, it goes ahead and executes the code required to fetch the value of the variable.
Technically, while debugging when we hit the breakpoint, all the threads other than the one on which the application is running are frozen. So, if we need a code to be executed which requires a separate thread, it will create a deadlock. This scenario is prevented by a mechanism where the debugger allows only 5 seconds of time to the evaluation code. If the evaluation code cannot return any value within those 5 seconds, the debugger returns a Function evaluation timed out. message.
It is obviously little irritating to wait for 5 seconds and then get to know about Function evaluation timed out. To prevent that, we have a notification mechanism which can tell that a particular execution requires other threads as well and might take time.
System.Diagnostics.Debugger.NotifyOfCrossThreadDependency() method is used to perform this function. We can add this method to the properties where we, as developers, feel that it might take more time as shown below.
It shows us the message for the Salary property.

If we still go ahead and evaluate it, it'll show us the value.

Hope this helps.
No comments:
Post a Comment